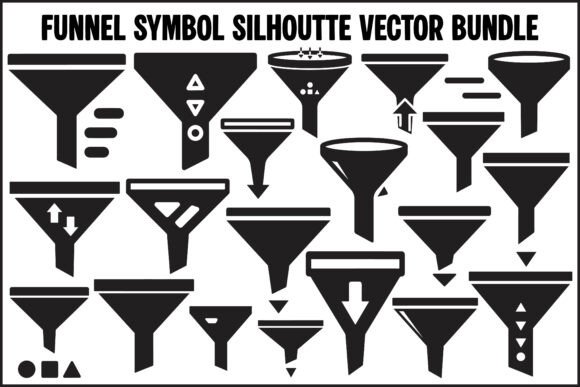
Funnel Symbol Silhouette Vector Bundle
Visual clarity matters—especially when explaining how data moves, transforms, or narrows. The Funnel Symbol Silhouette Vector Bundle delivers 20 clean, intentional icons that represent filtering, sorting, process flow, and data progression—not as abstract shapes, but as functional design assets you can deploy with confidence.
Each icon is built around a strong silhouette principle: bold outlines, balanced negative space, and consistent stroke weight. They’re black by default—not because they’re limiting, but because that neutrality invites customization. You decide the color, size, context, and meaning. That’s where practical creativity begins.
Why these funnel symbols work where others fall short
Many “funnel” icons lean too literal (think cartoonish hourglasses or tapered tubes) or too generic (overused arrows-in-a-cone). This bundle avoids both traps. Instead, it interprets the funnel concept through modern UI logic: a filter icon shows layered grids with subtle cutouts; a sorting symbol uses ascending/descending bars with clean alignment; a data flow icon traces a smooth, directional path across nodes—no clutter, no ambiguity.
That intentionality makes them legible at small sizes in dashboards, scalable for large-format print, and adaptable across platforms without visual compromise. More importantly, they support storytelling—not just decoration. When your audience sees a sorting icon next to a column header, they instantly grasp interactivity. When a filter icon appears beside a search bar, expectations align before a single word is read.
Real projects, real users
For UX designers: Drop the SVG files directly into Figma or Adobe XD. Change fill colors to match your brand system in seconds. Use the EPS versions to build interactive component libraries in Illustrator—then export variants for light/dark mode. Because all paths are fully editable, you can adjust corner radius or spacing to match your design tokens precisely.
For marketers and educators: These icons strengthen presentations and reports without overwhelming slides. A PNG with transparent background fits cleanly over gradient headers or photo backgrounds. Pair the “process” icon with three concise bullet points to visualize a customer journey—or use the “data flow” icon to map how survey responses move from collection to analysis. Consistency here builds credibility: viewers recognize the visual language across decks, emails, and landing pages.
For developers and product teams: SVGs load fast, scale infinitely, and integrate smoothly into React, Vue, or HTML/CSS workflows. No need to manage multiple raster sizes—just one file adapts to retina displays, mobile breakpoints, and embedded widgets. And because each SVG has semantic naming (e.g., icon-filter-basic.svg), your code stays readable and maintainable.
How to keep your use clear and effective
Start with purpose—not aesthetics. Ask: *What action does this icon support? What question does it answer?* A sorting icon shouldn’t just look nice beside a table—it should signal that clicking will reorder rows. If your audience includes non-technical stakeholders, pair the icon with a micro-label (“Sort by date”) on first use, then rely on visual recognition later.
Maintain consistency in sizing and spacing. In dashboards, use the same icon height (e.g., 24px) across all modules. In infographics, align baselines so icons feel anchored—not floating. Avoid mixing styles: don’t combine these sharp silhouettes with hand-drawn or 3D icons in the same layout. Visual harmony reinforces message clarity.
Don’t assume transparency equals flexibility. While the PNGs have transparent backgrounds, test them over your actual content—some light grays or soft gradients may cause edge halos. For web use, prefer SVG unless you need fallback support for very old browsers. For printed reports or large banners, EPS ensures crisp output at any dimension.
Creative variations—without starting from scratch
You don’t need to reinvent the funnel concept to make it fresh. Try these grounded adaptations:
- Color layering: Apply two-tone fills—one for the main shape, another for an internal detail—to imply hierarchy (e.g., dark blue for “filter,” lighter blue for “applied criteria”).
- Animation hints: Use the SVG paths as motion targets. Animate the “data flow” icon’s line drawing to show progression in a tutorial video or onboarding sequence.
- Contextual pairing: Combine the “sorting” icon with a minimalist bar chart SVG (from your own library) to create a custom “top performers” module—no stock illustrations needed.
- Typography integration: Overlay a subtle funnel silhouette behind a headline like “Your Data, Refined”—using low opacity and a neutral tone. It adds texture without competing for attention.
None of these require illustration skills—just thoughtful placement and restraint.
Who benefits most—and why
Freelancers building client dashboards appreciate the time saved: no hunting for compatible, licensable icons. Small business owners updating their analytics reports get professional polish without hiring a designer. Educators creating workshop handouts avoid clipart clichés while keeping visuals accessible. Bloggers illustrating SaaS concepts gain visual shorthand that readers understand immediately—even on mobile.
What ties these users together isn’t just access to files—it’s access to *intention*. Every icon in the Funnel Symbol Silhouette Vector Bundle was designed to serve a function first, an aesthetic second. That balance is rare. And it’s why these assets hold up across contexts: a presentation slide, a mobile app toolbar, a printed annual report, or an open-source documentation site.
Use them as anchors—not flourishes. Let them clarify, not decorate. And when you do, you’re not just choosing icons—you’re choosing clarity, efficiency, and quiet professionalism.